Reports
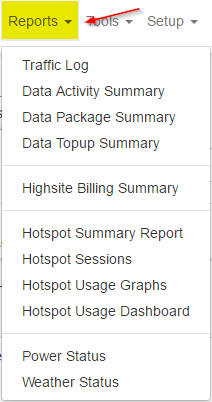
In reports you can view all the basic information you need to know about your HeroTill. It includes Logs, Summaries, Sessions, Graphs, Dashboards and Statuses. It is very useful to get information about a specific part of HeroTill.
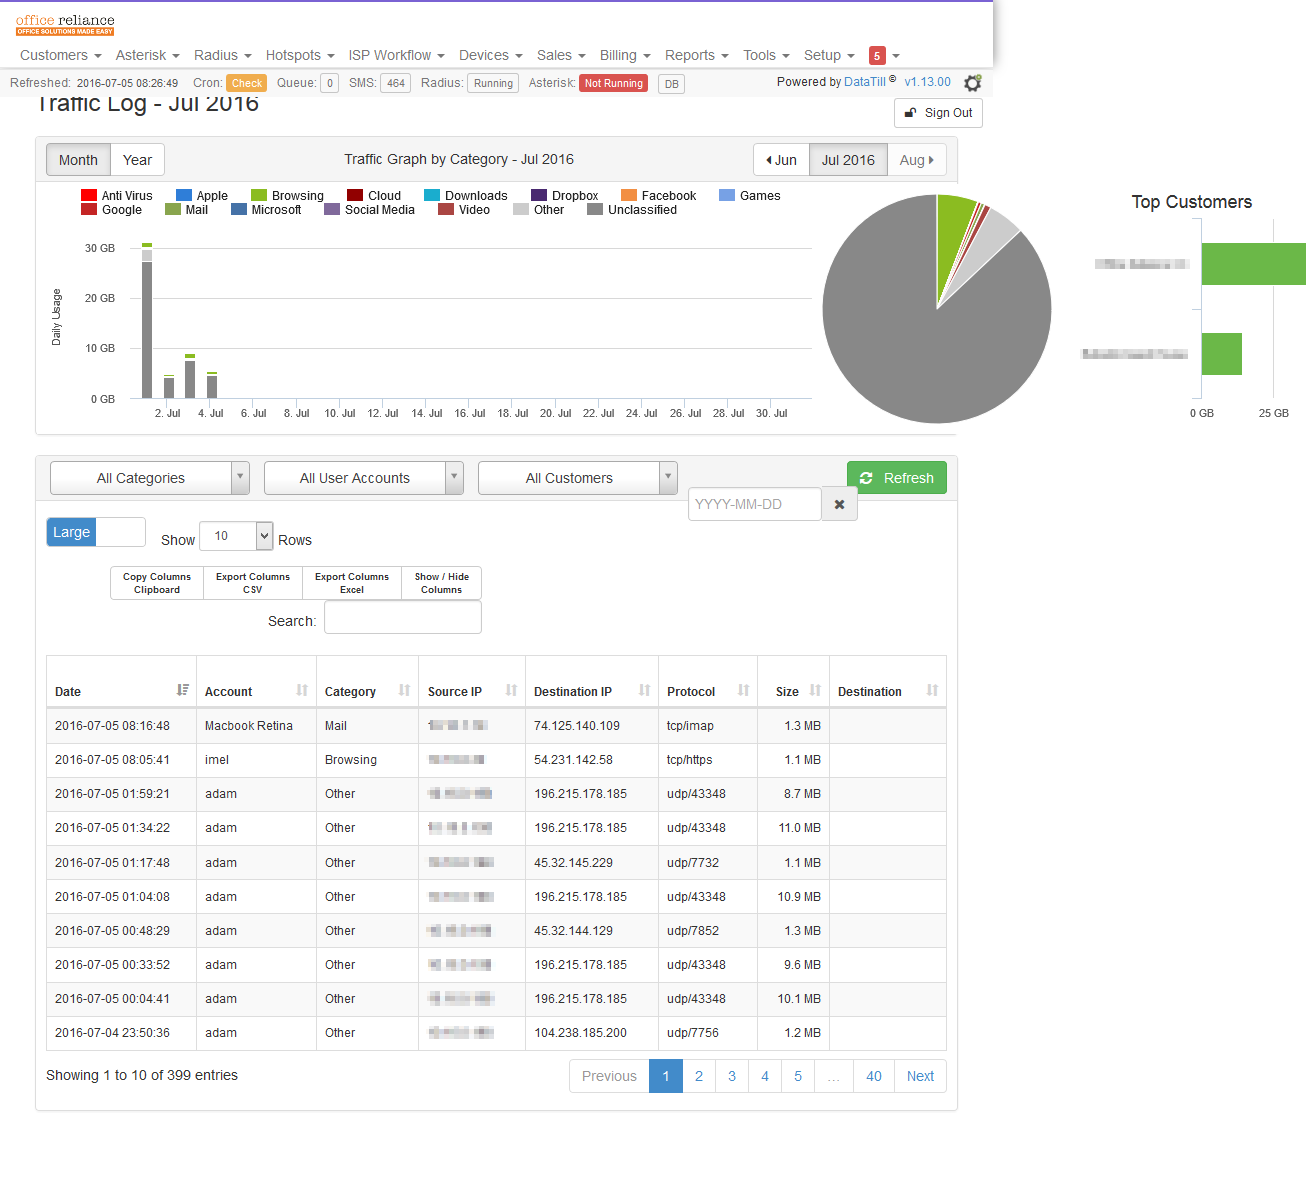
Traffic Log
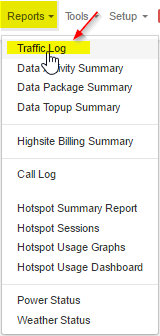
In the traffic log you can see almost exactly what customers have been doing on their line. It can be set to show on a monthly basis or a yearly basis.
 Data Activity Summary:
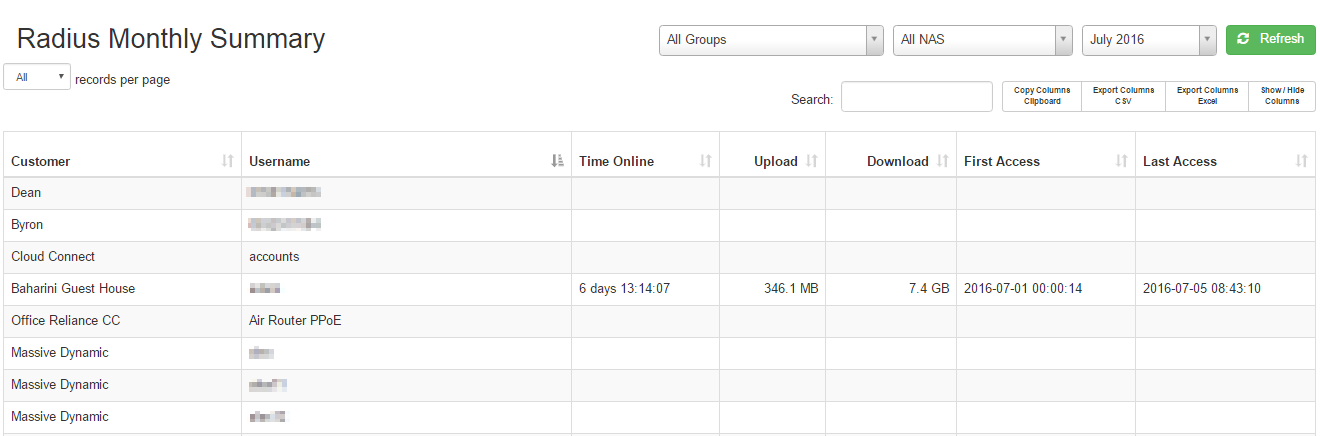
This will show a radius monthly summary. It will show you the customer, username, time online, upload, download, first access and last access. This is useful because you can see all the customer usage and the time they have been active at the same time.
 Data Package Summary:
This shows a summary of all of the monthly data packages. It shows the package, monthly cape, monthly usage and monthly cost of the packages with a total. 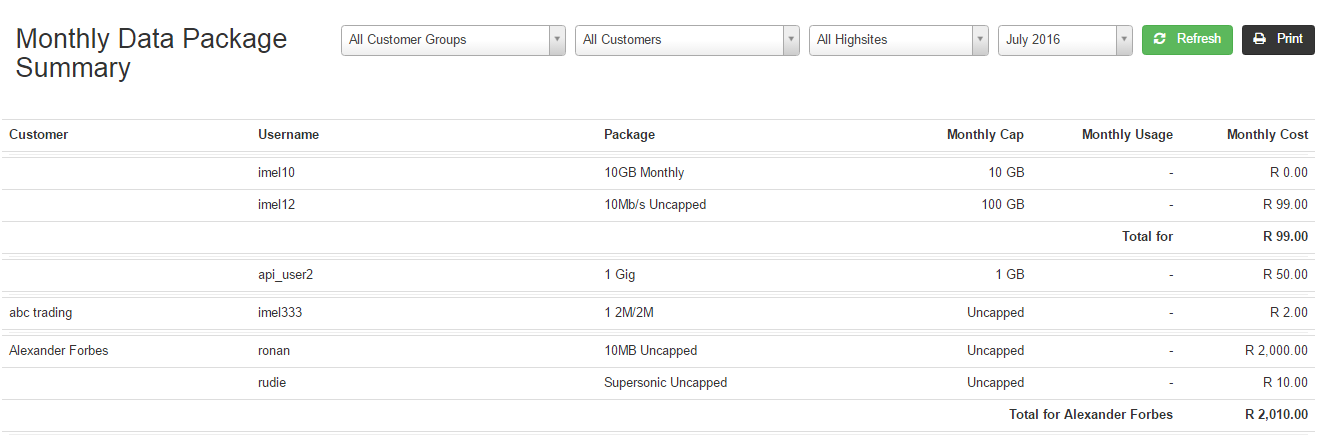
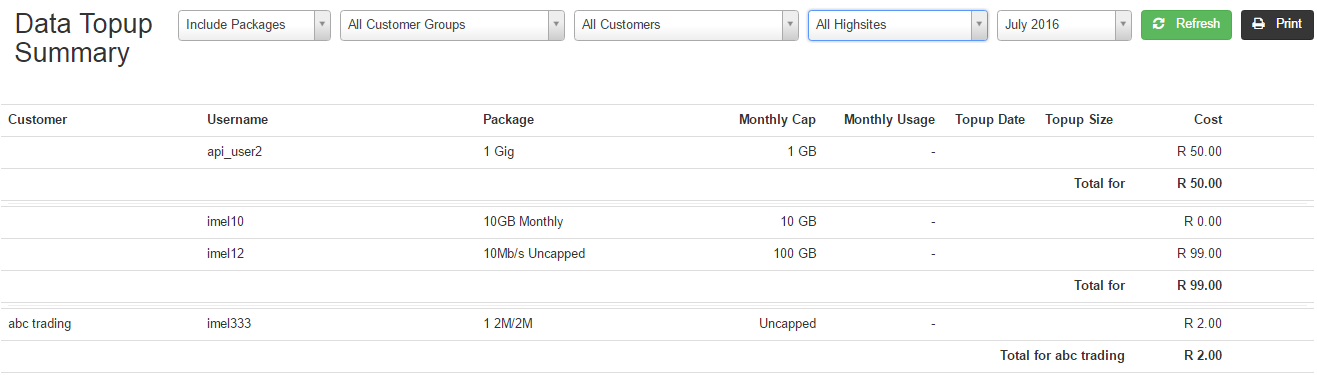
Data Topup Summary:
Data Topup Summary will show you the Package, Monthly Cap, Monthly Usage, Topup Date, Topup Size and the Cost.
 Highsite Billing Summary:
In this report you will be able to view a summary of your Highsite Billing. This includes the number of users, average data usage of all users in the NAS, averge monthly billing, Total Data Usage, Total Monthly billing. 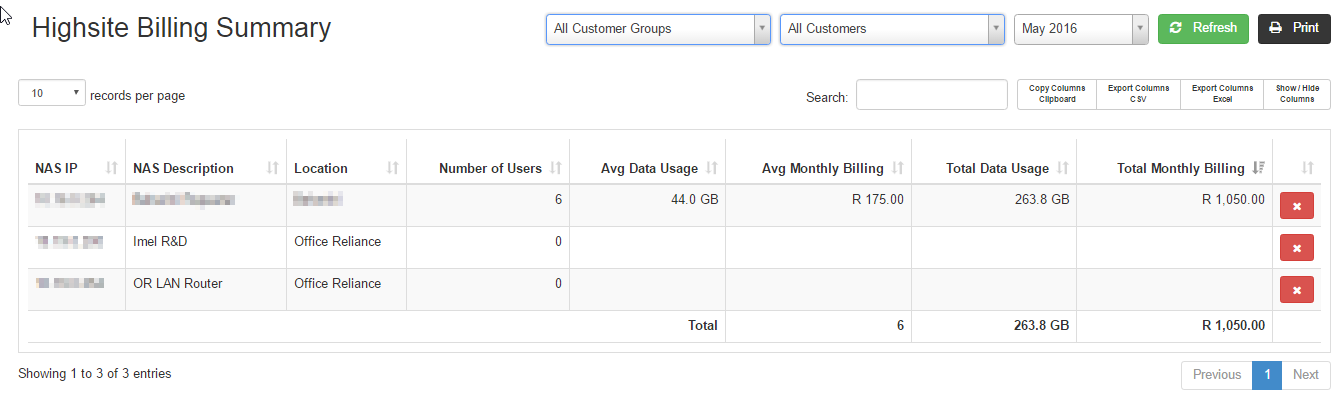
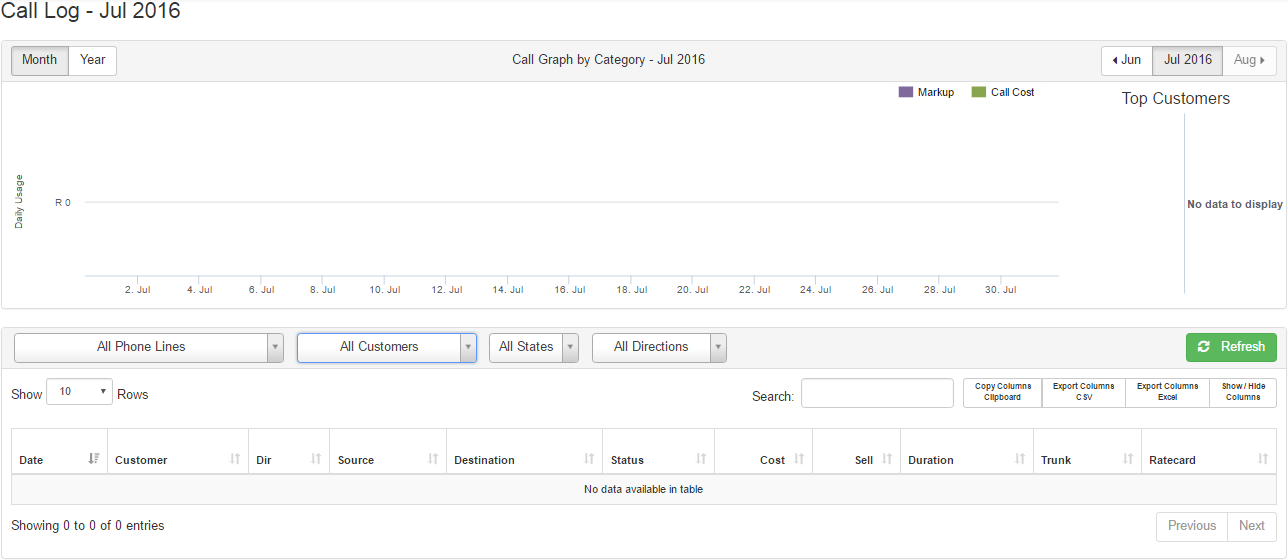
Call Log:
The call log mostly shows you the amount of mark ups and call costs for the top 4 customers. You can view it on a monthly basis or a yearly basis. Also you can narrow down the graph to specific customers.
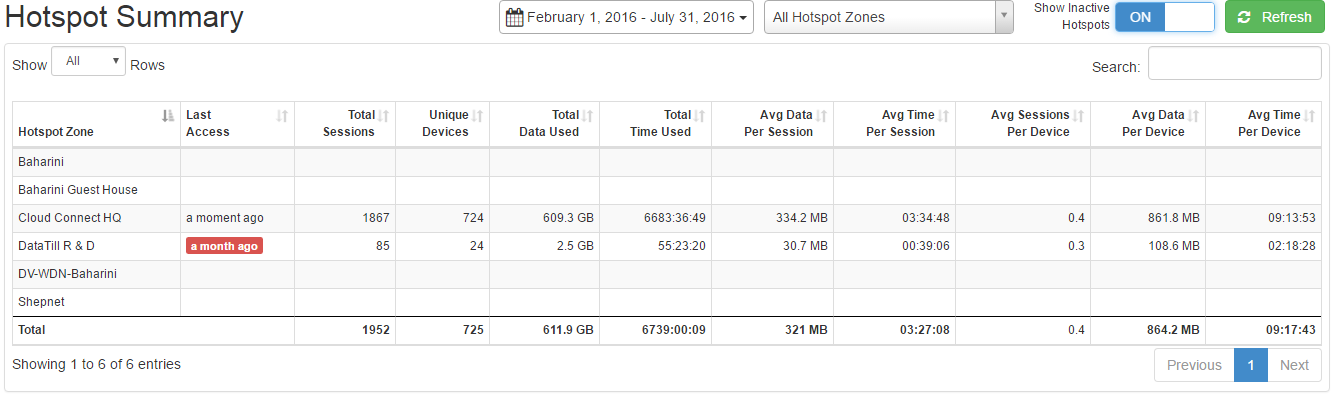
 Hotspot Summary Report:
This gives you a summary of all active and inactive hotspots from the specific dates and the different hotspot zones. The summary contains the Hotspot Zone, Last Access, Total Sessions, Unique Devices, Total Data Used, Total Time Used, Avg Data Per Session, Avg Time Per Session, Avg Sessions Per Device, Avg Data Per Device, Avg Time Per Device.
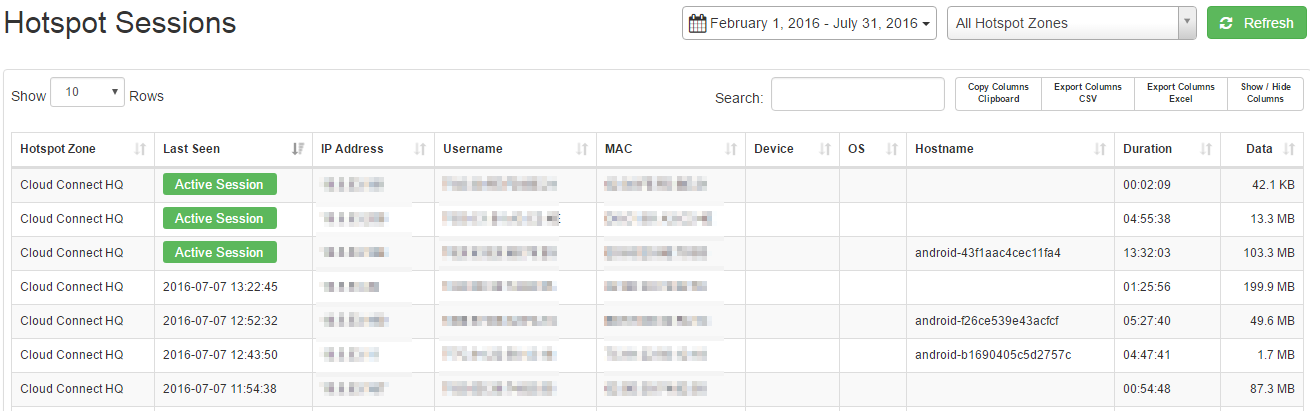
 Hotspot Sessions:
The Hotspot Sessions Report shows you a list of all sessions on the set date from all zones or the specific zone of your choosing. It will show yo the Hotspot Zone, Last Seen, IP Address, Username, MAC, Device, OS, Hostname, Duration and Data. It is also a good way of seeing which Sessions are active and inactive for each zone.
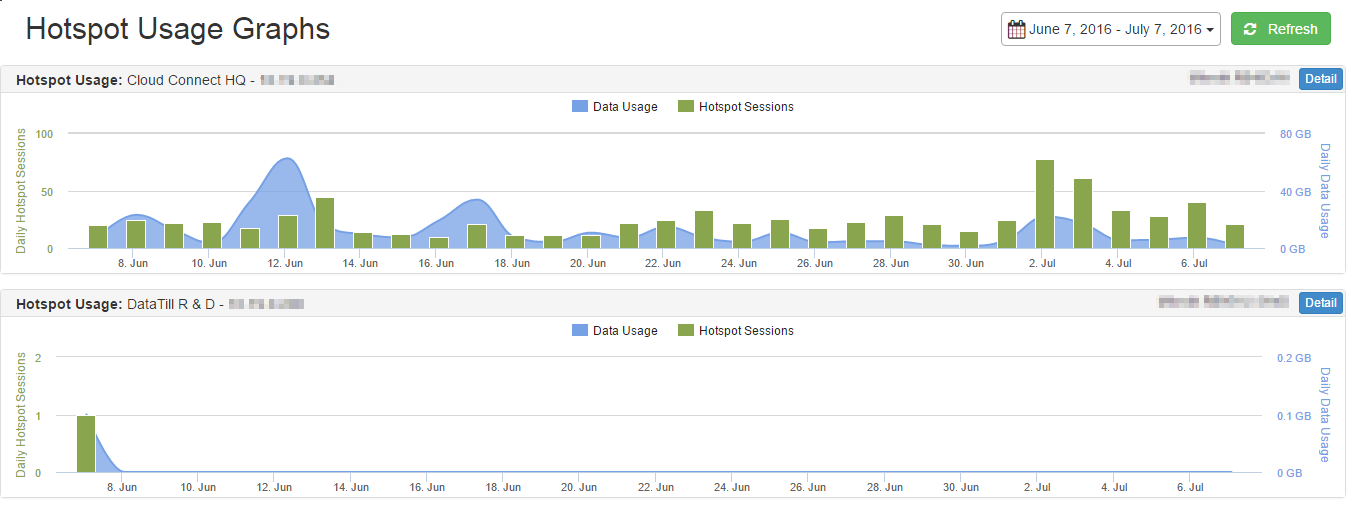
 Hotspot Usage Graph:
Hotspot Usage Graphs shows you graphs of all you MikroTik hotspots set up. The graphs are made out of the amount of Hotspot Sessions showed in green and the amount of Data Usage shown in blue. The date can also be changed to see the total Hotspot Sessions and total Data Usage for a specific day or month.
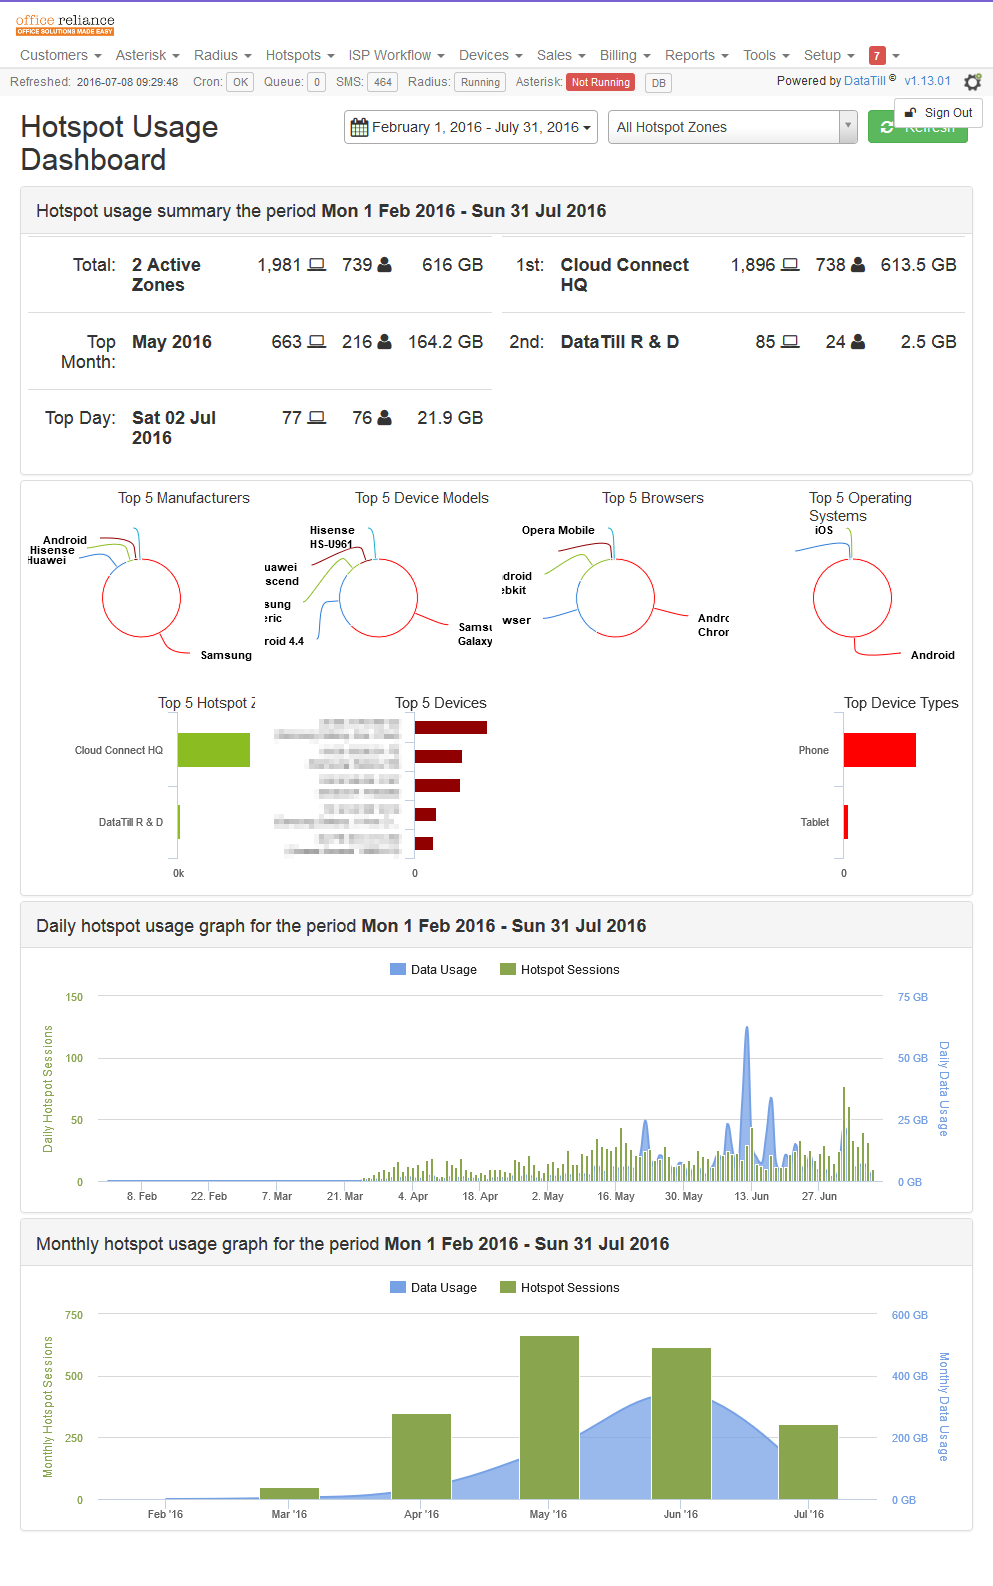
 Hotspot Usage Dashboard:
The Hotspot Usage Dashboard shows you a summary of the total active zones and which zone had the highest data usage and the most users. It also shows you the top month and the top day. It also shows you a graph of the top 5 manufacturers, top 5 device models, top 5 browsers, top 5 operating systems, top 5 hotspot zones, top 5 devices, top device types. A daily and monthly graph is generated of the Data Usage and Hotspot Sessions.
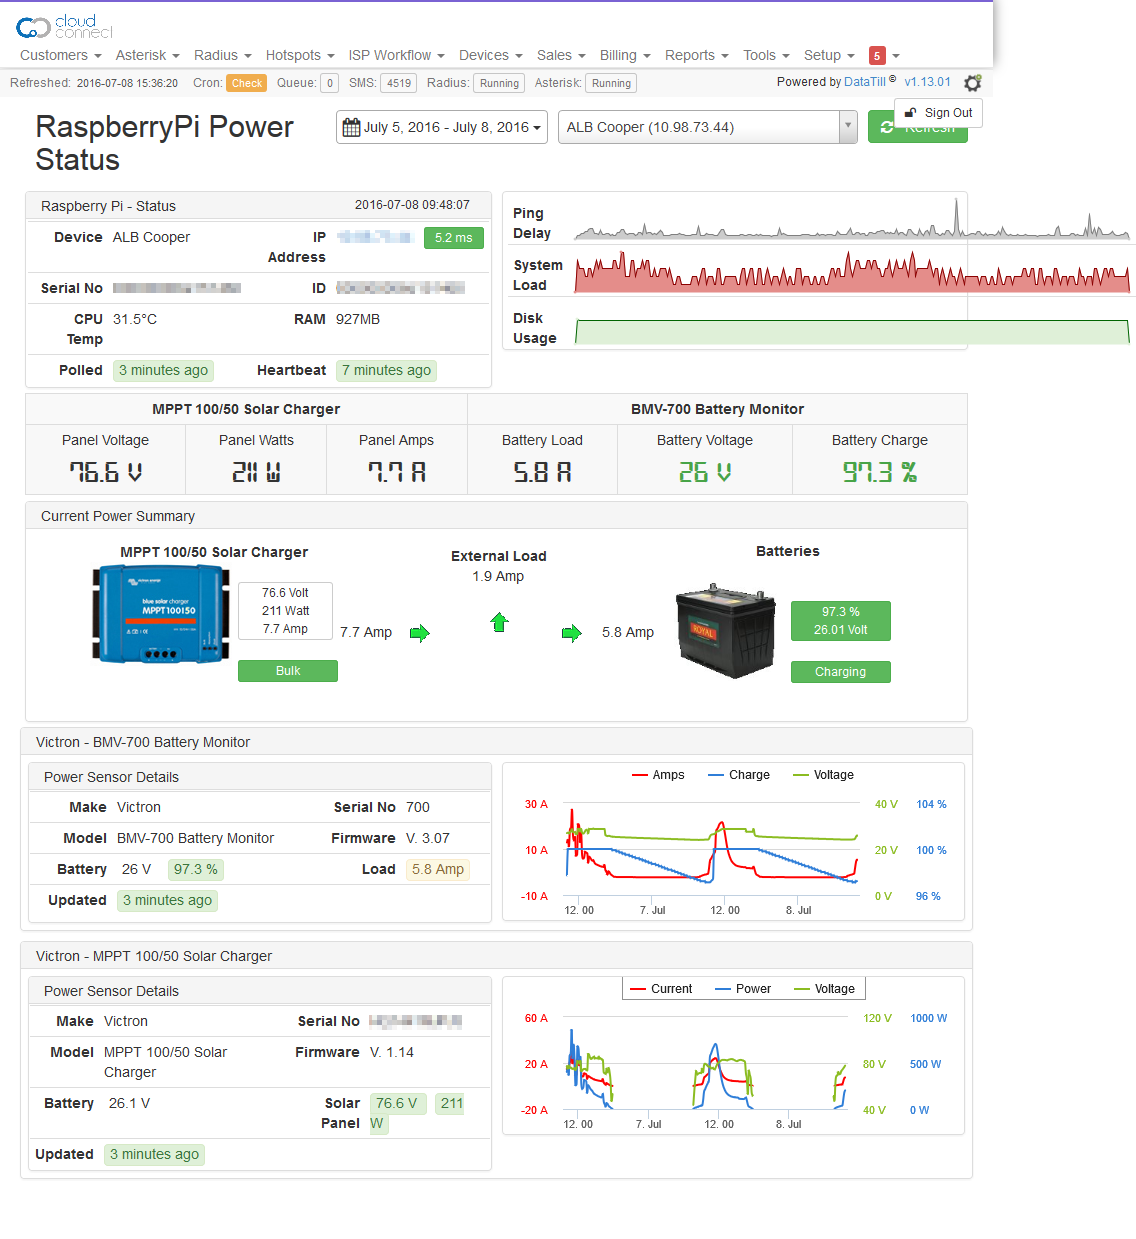
Power Status:
The Power Status page tells you the status of your Raspberry Pi’s and also a summary of the battery power. It tells you the Make, Serial No, Model, Firmware, Battery, Load, and the last time it was updated of the Power Sensor. This includes the Battery Monitor and Solar Charger. Graphs of each are made out to see a good view of usage.
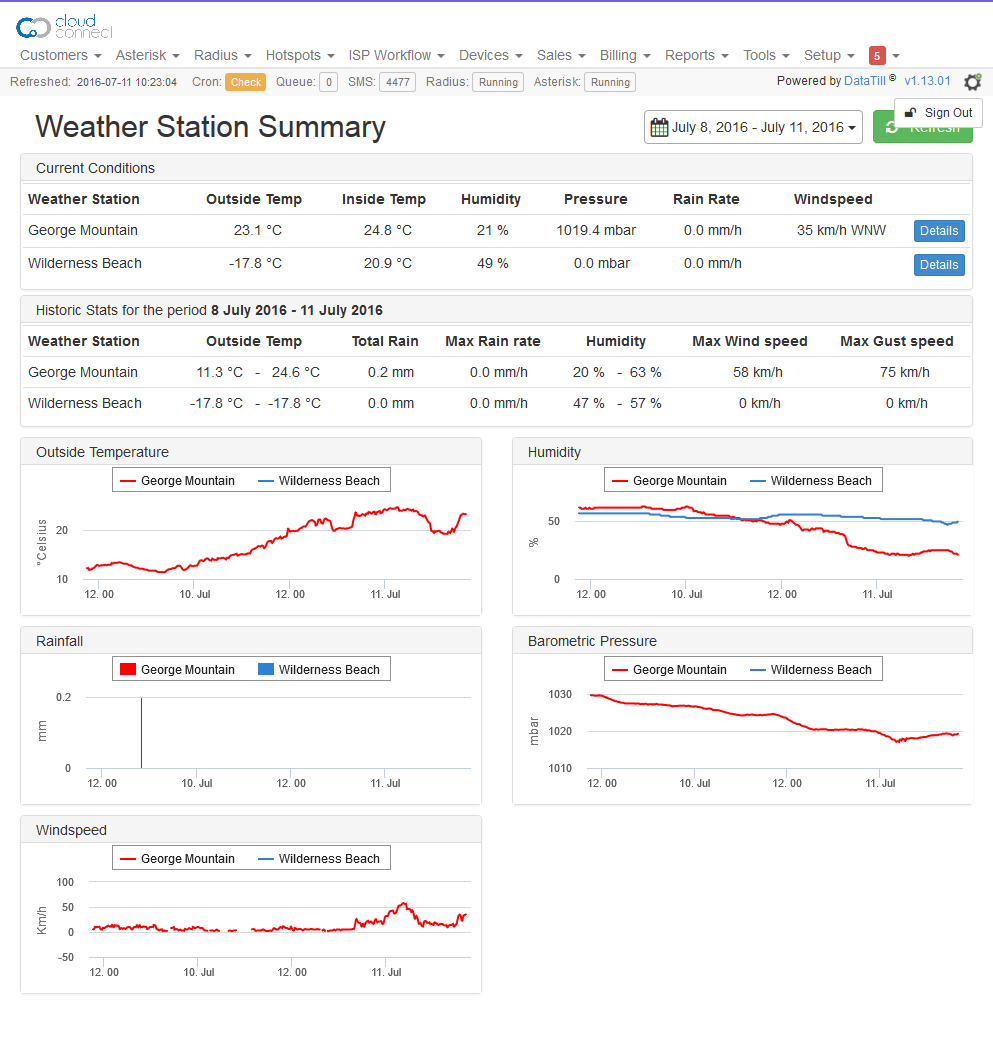
Weather Status:
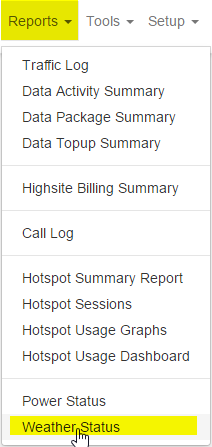
This gives you a summary of the weather at all the locations a Raspberry Pi is set up to as a Weather Station It gives a summary of Current Conditions and Historic Stats for the current month. It also gives a graph of the Outside Temperature, Humidity, Rainfall, Barometric Pressure and Windspeed of all weatherstation locations.