
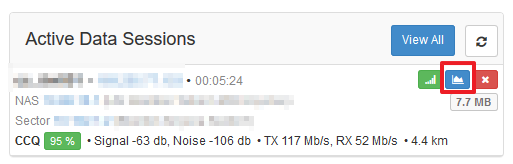
On the “Active Data Sessions” widget on the customer edit screen (customer profile), you can now see the real-time usage graph for active radius users.
Click on the “Show Real-time usage graph” button on the widget:
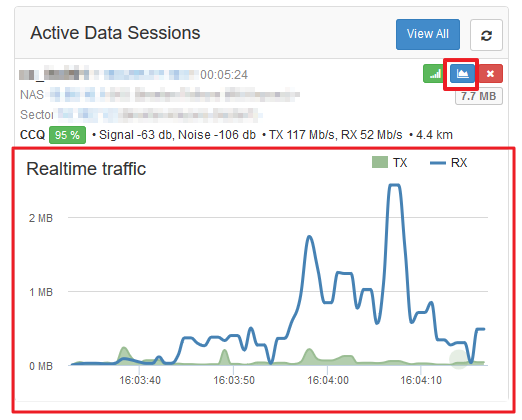
After clicking on the real-time usage graph button, it will start to display usage in real time:
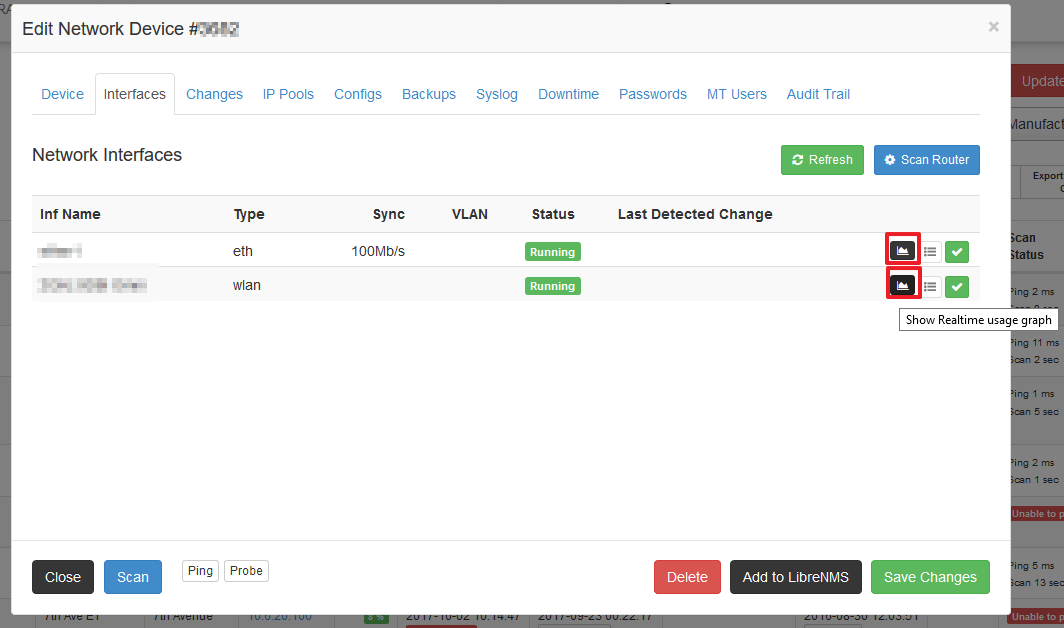
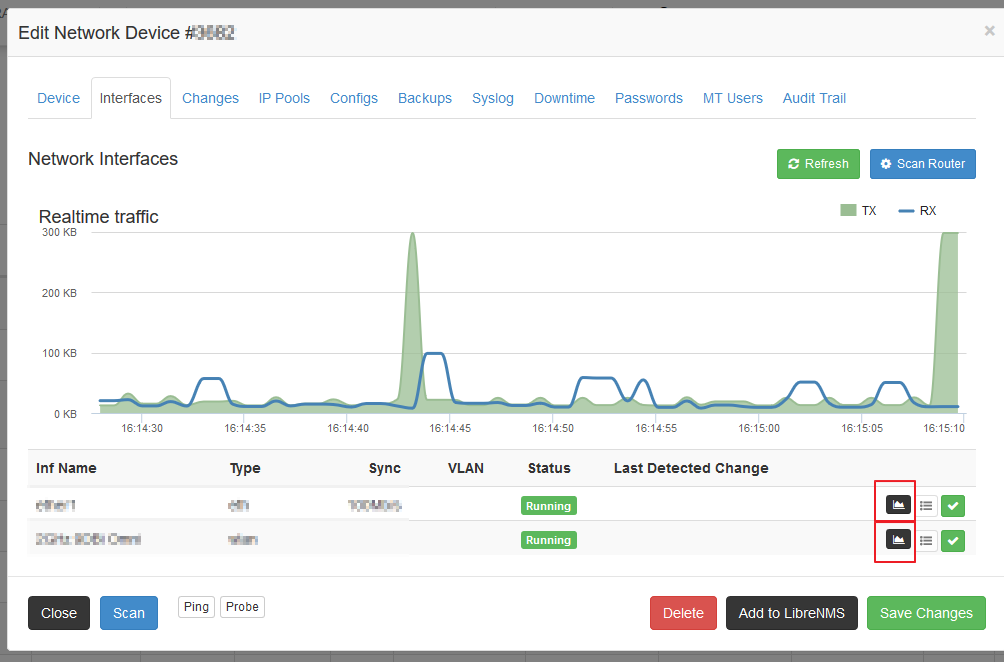
You can also view real-time usage graphs on devices themselves by going to Devices –> Network Devices –> Edit a Device –> Go to Interfaces tab
Note:
If you click on the button to show real-time usage and the device is not configured correctly, you will see the following popup on the edit customer screen:
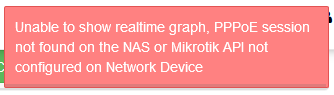
“Unable to show real-time graph, PPPoE session not found on the NAS or Mikrotik API not configured on Network Device”